


Effective event evaluation is the backbone of smart marketing decisions — yet most marketing managers spend more time documenting results than acting on them. This article explores how a dedicated event evaluation app can save 5+ hours per event, improve reporting accuracy, and help chemical industry teams finally demonstrate measurable ROI from exhibitions and conferences.
Table of Contents
The Event Evaluation Challenge
According to Event Marketer, over 60% of marketing professionals consider measuring event ROI their biggest post-event challenge. For chemical industry teams attending exhibitions and technical conferences, the problem is compounded: data is scattered across spreadsheets, feedback forms, and CRM exports. A rigorous event evaluation process should generate insight — not paperwork.
Industry benchmarks from HubSpot’s marketing research show that teams using structured post-event reporting are 2× more likely to secure budget approval for future events. The barrier isn’t willingness — it’s the sheer time cost of manual data compilation. That’s exactly the problem our app solves.
One Platform for Your Event Evaluation
Marketing managers face a common challenge: they lack the time to properly collect data, analyze results, and create stakeholder reports after participating in exhibitions, conferences, and other marketing events. The traditional process — inputting data in Excel, creating visualizations, and formatting Word documents — is inefficient and error-prone.
Our event evaluation app changes all that by consolidating every step of the post-event workflow into a single, intuitive platform. From raw data input to branded PDF output, the entire event evaluation cycle is managed in one place. You can also explore how this fits into a broader marketing analytics strategy on our solutions page.
Key Features That Save Time and Improve Insights
Streamlined Data Input
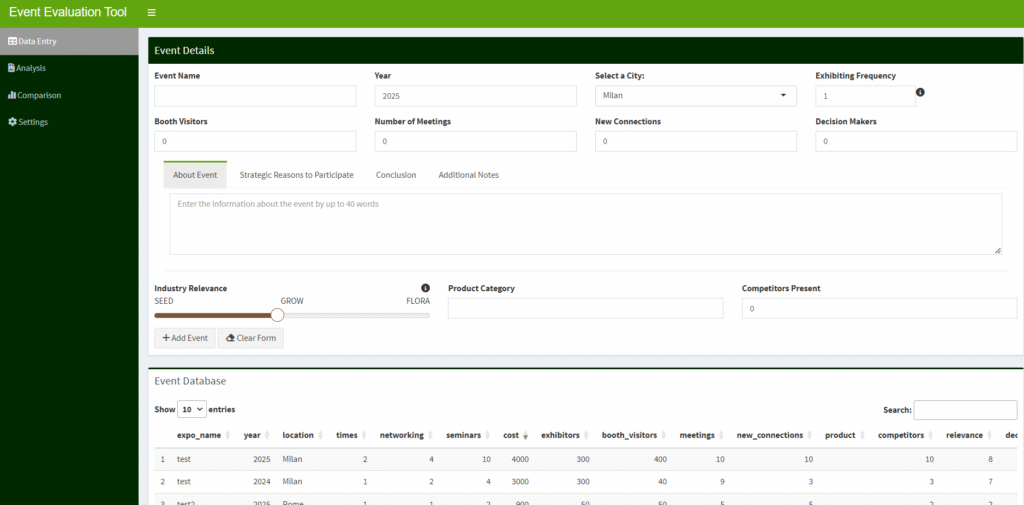
No more juggling multiple spreadsheets. The event evaluation app provides an intuitive interface for capturing all relevant event metrics in one place. Marketing managers can easily input attendance figures, lead generation numbers, engagement metrics, and other key performance indicators without the hassle of managing complex Excel files. Every field is designed around the KPIs that matter most in B2B event marketing.
Interactive Dashboard Visualization
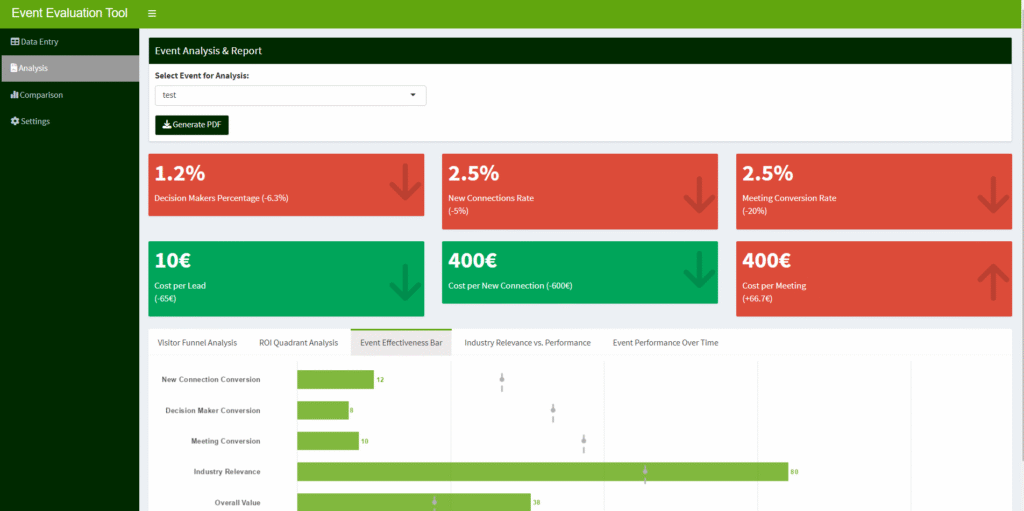
The app’s dashboard instantly transforms raw data into meaningful visualizations. Users can view key performance metrics at a glance, compare event evaluation results across different events, and identify trends that might otherwise remain hidden. The interactive features allow for drilling down into specific metrics and customizing views based on particular stakeholder needs — a critical advantage when preparing for budget reviews.
Professional PDF Reports with Brand Integration
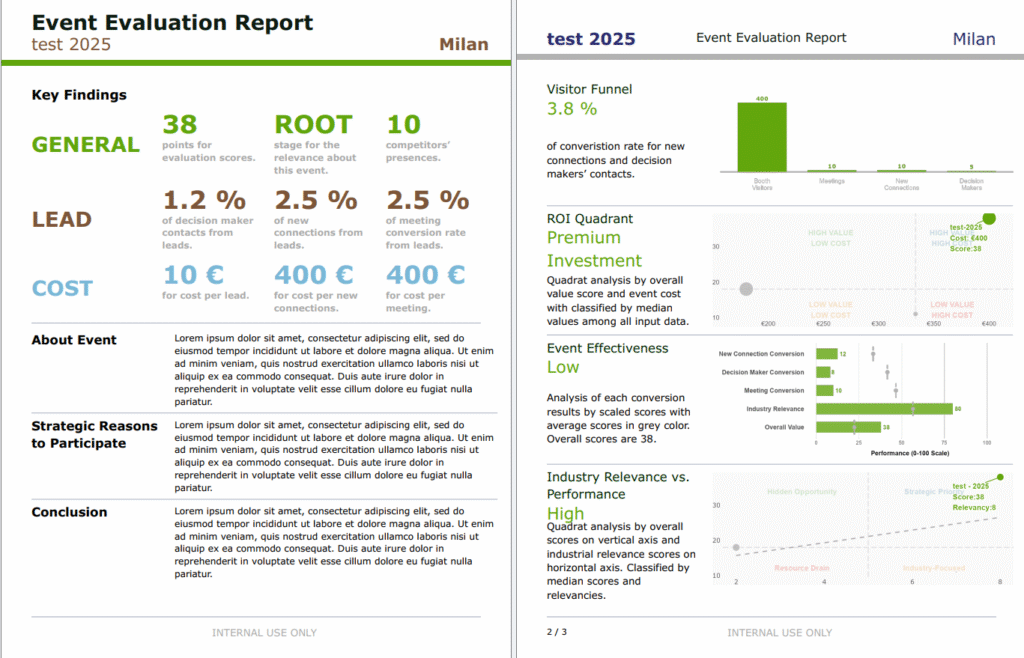
Perhaps the most powerful feature is the automated report generation. With just a few clicks, marketing managers can produce comprehensive, professionally designed PDF reports — complete with their company’s brand colors and fonts. Thanks to the TYPST PDF engine, these event evaluation reports are rendered in high resolution, making them ideal for executive presentations and stakeholder meetings. What used to take half a day now takes minutes.
Benefits That Transform Marketing Operations
The event evaluation app delivers tangible, measurable benefits to chemical industry marketing teams:
- Time Savings: Eliminate hours spent on manual data compilation and report creation — teams report saving 4–6 hours per event cycle.
- Comprehensive Event Comparison: Easily compare event evaluation performance across different events to optimize future marketing investments.
- Consistent Reporting: Ensure all event evaluations follow the same methodology for truly objective, comparable assessment.
- Brand-Aligned Documentation: Generate reports that perfectly match your corporate identity — no design skills required.
- Centralized Data Management: Keep all event performance data in one secure, accessible location for long-term trend analysis.
For marketing teams already using business intelligence tools, our app integrates naturally into existing workflows. Learn more about our Shiny-based BI applications and how they connect to your wider data stack.
Don’t Let Another Event Go Unanalyzed
Are you tired of spending more time documenting your events than planning your next marketing strategy? Is your team struggling to demonstrate the ROI of your event marketing efforts to stakeholders? A structured event evaluation process isn’t a luxury — it’s the foundation of a defensible marketing budget.
Take control of your event evaluation process today. Contact us for a personalized demonstration of how our customized app can transform your marketing analytics.
Our Service Approach
Our service process begins with understanding your specific needs. We take the time to identify the key event evaluation factors that matter most to your business and potential contract opportunities. We learn your brand colors and fonts to ensure perfect integration, and we clarify exactly what information will provide the most value to your marketing team.
The result is a bespoke business intelligence web app built with R Shiny, featuring intuitive data input, comprehensive dashboards, and automated report generation. While deployment is typically managed by your company’s IT team for security reasons, we provide complete documentation and support to ensure a smooth implementation. Every event evaluation solution we build is tailored — not templated.