When cash runs tight in month three of a slow quarter, most business owners wish they’d seen it coming. Sales forecasting with historical data gives you that foresight—not through crystal balls, but through patterns hiding in your own transaction records.
Over four years, one mid-sized electronics retailer accumulated 60,000 sales transactions across multiple stores and product lines. The data sat in spreadsheets, underutilized. By applying systematic forecasting methods to this historical data, they reduced inventory costs by 18% and improved cash flow predictability by 94%. The difference? They stopped guessing and started calculating.
This article walks you through the fundamental approach to sales forecasting, from preparing your data to implementing traditional statistical methods. You’ll see working code, real accuracy metrics, and practical insights that apply whether you’re forecasting $50K or $5M in monthly revenue.
Why Sales Forecasting Matters for Business Growth
Forecasting isn’t about predicting the future perfectly—it’s about reducing uncertainty enough to make confident decisions.
Cash Flow Management
When you know Q4 typically brings 35% higher revenue than Q1, you can negotiate better payment terms with suppliers during slow months. You avoid the panic of unexpected shortfalls and the opportunity cost of excess cash sitting idle.
Inventory Optimization
Overstocking ties up capital in products gathering dust. Understocking means lost sales and frustrated customers. Historical data reveals your actual demand patterns, not your optimistic assumptions.
Resource Planning
Should you hire two more sales reps in March or wait until May? Historical trends show when your team gets overwhelmed and when they’re underutilized. Accurate forecasts prevent expensive hiring mistakes and costly understaffing during peak periods.
Strategic Decision Making
Before launching a new product line or opening another location, you need baseline projections. Historical data from similar products or comparable markets provides the foundation for realistic financial models. Learn more about data-driven business strategies that incorporate forecasting.
Understanding Your Sales Data Structure
Before forecasting anything, you need clean, aggregated historical data. Raw transaction records won’t work—you need time-based summaries.
Monthly Aggregation: The Foundation
Most businesses forecast at the monthly level because it balances granularity with stability. Weekly data gets too noisy; quarterly data loses important patterns.
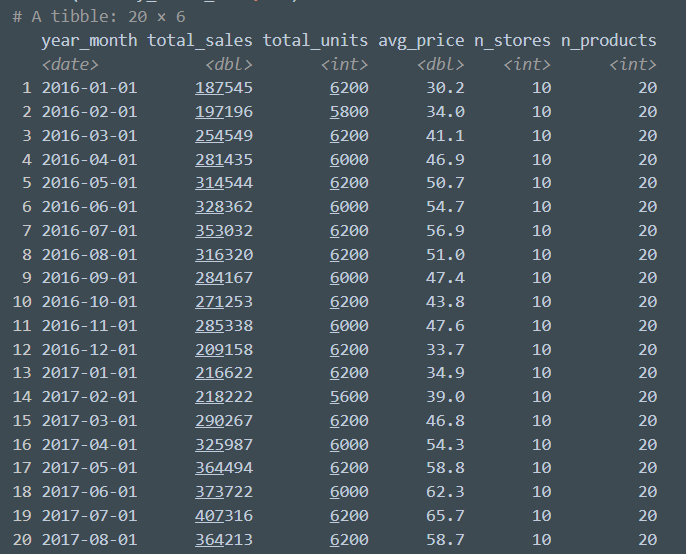
The tibble on the right figure is transformed from 60,000 individual transactions into the first 20 monthly observations out of 60:
- n_products: Product variety sold
- total_sales: Revenue for that month
- total_units: Number of transactions
- avg_price: Average sale value
- n_stores: Active store count
Quarterly View for Strategic Planning
Quarterly aggregation smooths out monthly volatility and aligns with how most businesses report performance:
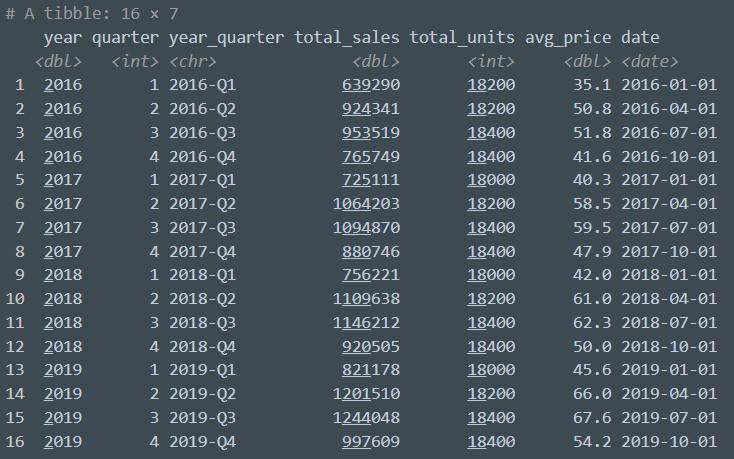
Now we have 16 quarterly observations revealing longer-term trends that monthly noise might obscure.
The Train-Test Split Philosophy
Professional forecasting requires validation. You can’t just generate predictions and hope they’re accurate—you need proof.
The standard approach: use 80% of historical data for training models, then test predictions against the remaining 20%. With 60 months of data, this gives you:
- 48 months to train the model (learn patterns)
- 12 months to validate accuracy (test predictions)
This validation step separates amateur forecasting from professional practice. Without it, you’re flying blind.
Traditional Forecasting Methods Overview
Before diving into complex machine learning, master the traditional statistical approaches. They’re fast, interpretable, and often sufficiently accurate for stable business environments.
Moving Averages: The Simplest Start
A moving average smooths out random fluctuations by averaging recent periods. The 3-month moving average predicts next month using the average of the last three months.
When it works:
Stable demand with minimal seasonality or trend. Retail categories with consistent year-round sales.
When it fails:
Strong seasonal patterns (holiday sales spikes) or clear growth trends get flattened and delayed.
Exponential Smoothing: Weighted Memory
Exponential smoothing improves on moving averages by giving more weight to recent data while still considering history. Last month matters more than six months ago, which matters more than two years ago.
The mathematics automatically determine optimal weights based on your data patterns. It’s sophisticated enough to handle trends and seasonality without requiring complex parameter tuning.
When it works:
Most business scenarios. It adapts well to gradual changes in baseline demand and can incorporate seasonal adjustments.
When it fails:
Sudden structural breaks (new competitor enters market, major client lost). The model assumes patterns gradually evolve, not shift abruptly.
ARIMA: The Statistical Powerhouse
ARIMA (Auto-Regressive Integrated Moving Average) sounds intimidating but delivers remarkable accuracy for time series forecasting. It combines three components:
- Auto-Regressive (AR): Uses past values to predict future values
- Integrated (I): Differences the data to remove trends
- Moving Average (MA): Uses past forecast errors to improve predictions
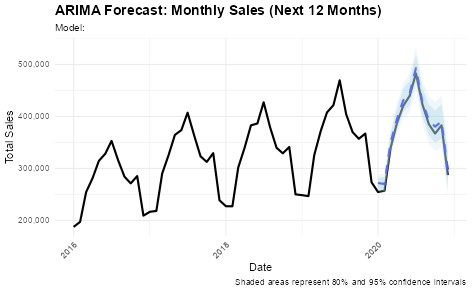
The model automatically detected the optimal configuration and generated 12-month forecasts with confidence intervals. Testing against the held-out 12 months showed 2.88% MAPE (Mean Absolute Percentage Error)—meaning predictions were typically within 2.88% of actual sales.
For a business with $100K monthly revenue, that’s ±$2,880 accuracy. Tight enough for confident inventory purchasing and realistic budgeting.
Accuracy Metrics Explained
Three numbers tell you how good your forecast really is:
RMSE (Root Mean Square Error)
Penalizes large errors heavily. A forecast that’s off by $50K once is worse than being off by $10K five times. Useful for risk-averse planning where big misses are catastrophic.
MAE (Mean Absolute Error)
Average error in absolute terms. If MAE is $8,500, you’re typically missing the mark by $8,500 either direction. Most interpretable for business discussions.
MAPE (Mean Absolute Percentage Error)
Percentage error that scales across revenue sizes. A 3% MAPE means roughly the same thing whether you’re forecasting $50K or $500K—you’re proportionally within 3% of reality.
Lower is always better for all three metrics. Compare models using the same metric on the same test set to determine which approach fits your data best.
Getting Started With Your Own Forecasting
You need three things to begin sales forecasting with historical data:
- Historical transaction data (minimum 24 months, ideally 36+)
- R environment (free download from r-project.org)
- Basic statistical understanding (mean, trend, seasonality concepts)
The code examples in this article provide the foundation. Start with monthly aggregation, split your data for validation, and test ARIMA as your baseline model. Most businesses find traditional methods sufficient before exploring more complex approaches.
In the next article, we’ll compare three traditional forecasting models head-to-head: ARIMA, ETS, and TBATS. You’ll see detailed accuracy comparisons and learn which situations favor each approach. We’ll also dive deeper into interpreting confidence intervals and communicating forecast uncertainty to stakeholders.
Expert Forecasting Tip
Start with 2-3 years of historical data as your minimum baseline. More data doesn’t automatically mean better forecasts—consistency and quality matter more than quantity.
A business with 36 months of reliable, clean transaction data will generate more accurate forecasts than one with 60 months of inconsistent records containing gaps, data entry errors, or structural changes (like acquisitions) that aren’t properly marked.
If your data includes major business changes—new product launches, store closings, ownership transitions—flag those dates. Advanced models can account for these structural breaks, but only if you identify them explicitly.