Traditional forecasting models assume your sales follow mathematical patterns—smooth trends, predictable seasonality, linear relationships. But what if last month’s promotional discount affects this month’s sales? What if the rolling 6-month average predicts better than any single past value? What if the relationship between December and January sales differs fundamentally from the relationship between June and July?
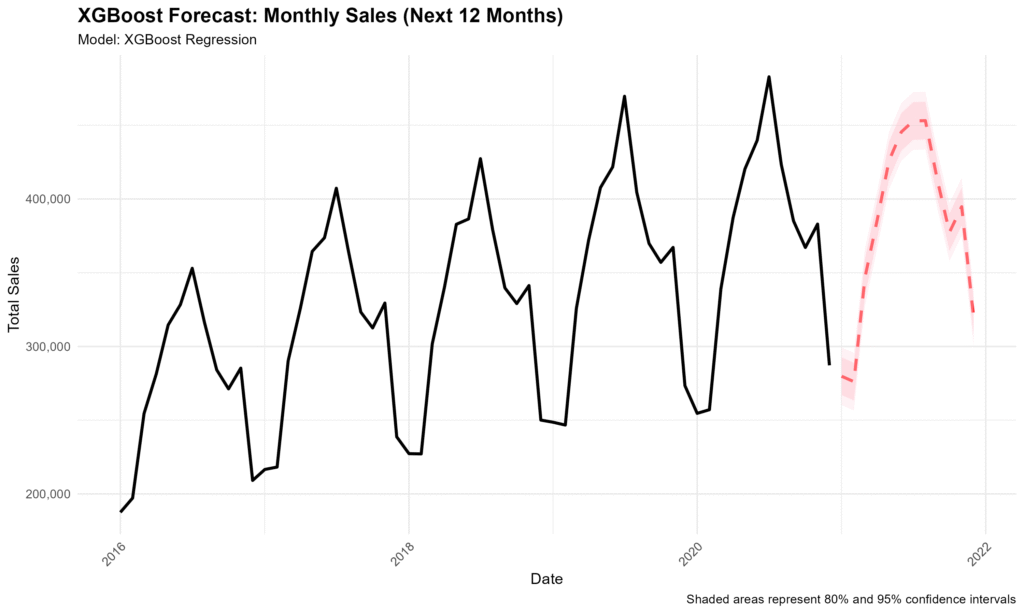
Machine learning sales forecasting with XGBoost doesn’t assume these patterns—it discovers them. By creating 18 engineered features from historical data and letting gradient boosting trees find complex relationships, one electronics retailer improved forecast accuracy beyond what traditional ARIMA models achieved.
This article walks through a complete XGBoost implementation for sales forecasting: feature engineering techniques, parameter tuning strategies, recursive multi-step predictions, and critical comparisons against traditional methods. You’ll see exactly when machine learning justifies the additional complexity and when simpler approaches win.
If you’re new to forecasting or need a refresher on traditional methods, start with our comparison of ARIMA, ETS, and TBATS models that establishes the baseline performance to beat.
Why Machine Learning for Sales Forecasting
Traditional time series models (ARIMA, ETS) excel at linear patterns but struggle with:
Non-linear relationships: Maybe sales spike exponentially during holiday weeks rather than adding a fixed amount. Linear models can’t capture exponential growth within seasonal patterns.
Complex interactions: Perhaps high sales in January only predict high February sales if the 3-month rolling average is also increasing. Traditional models don’t discover these conditional relationships automatically.
Multiple predictive patterns: Your sales might depend simultaneously on last month’s value, the 6-month trend, seasonal position, and recent volatility. ARIMA uses a fixed formula; XGBoost learns which combination matters most.
Automatic feature selection: You create 18 potential predictors, but only 7 actually improve forecasts. XGBoost’s feature importance reveals which variables drive your business—insight as valuable as the predictions themselves.
The XGBoost Advantage
XGBoost (eXtreme Gradient Boosting) builds an ensemble of decision trees sequentially. Each new tree corrects the errors of previous trees, creating a powerful predictive model through iterative refinement.
Key strengths:
- Captures non-linear patterns without manual specification
- Handles feature interactions automatically
- Provides feature importance rankings
- Resists overfitting through regularization
- Scales efficiently to large datasets
Trade-offs:
- Requires careful feature engineering
- Needs more data than traditional models
- Less interpretable than ARIMA equations
- Computationally intensive parameter tuning
- No built-in confidence intervals (requires approximation)
The question isn’t whether XGBoost is “better” than ARIMA—it’s whether your data exhibits the complexity that justifies machine learning’s demands.
Feature Engineering: Transforming Time Series for Machine Learning
Traditional models work directly with raw time series values. Machine learning requires you to transform timestamps and sales figures into meaningful predictive features.
Feature Importance Hierarchy
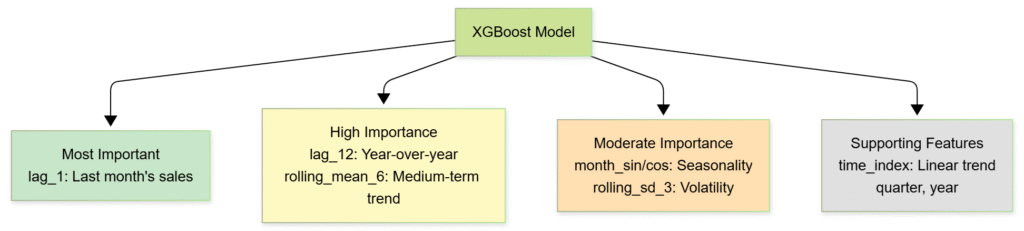
To implement an ML forecasting model, we need to prepare the predictive features as the diagram shows. Not all features contribute equally to prediction accuracy. The model learns which features matter most through training. This hierarchy emerges naturally from the data during training.
Feature Categories Visual Map
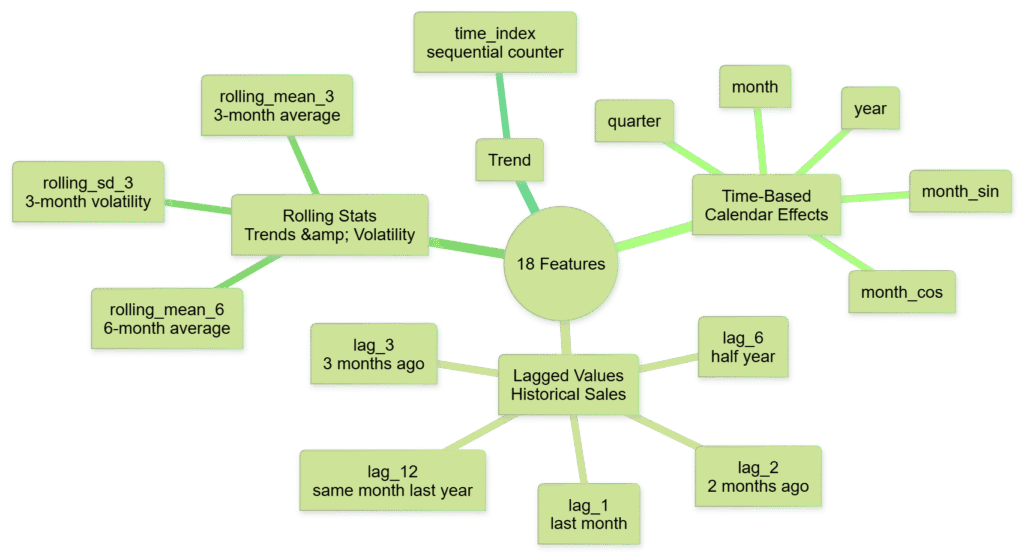
In the end, we need to prepare 18 features as the diagram shows. These features span four distinct categories, each capturing different aspects of your sales patterns. Time-based features encode calendar effects—the cyclical nature of months and quarters that drive seasonal demand. Lagged values preserve historical context, letting the model learn from recent momentum (lag_1, lag_2) and year-over-year patterns (lag_12). Rolling statistics reveal trends and volatility: 3-month and 6-month averages smooth out random fluctuations, while standard deviation measures uncertainty in recent performance. Finally, a simple time index captures linear growth or decline in your business over time. This combination of engineered features transforms raw monthly sales figures into a rich representation that XGBoost can learn from effectively.
Feature Engineering Overview
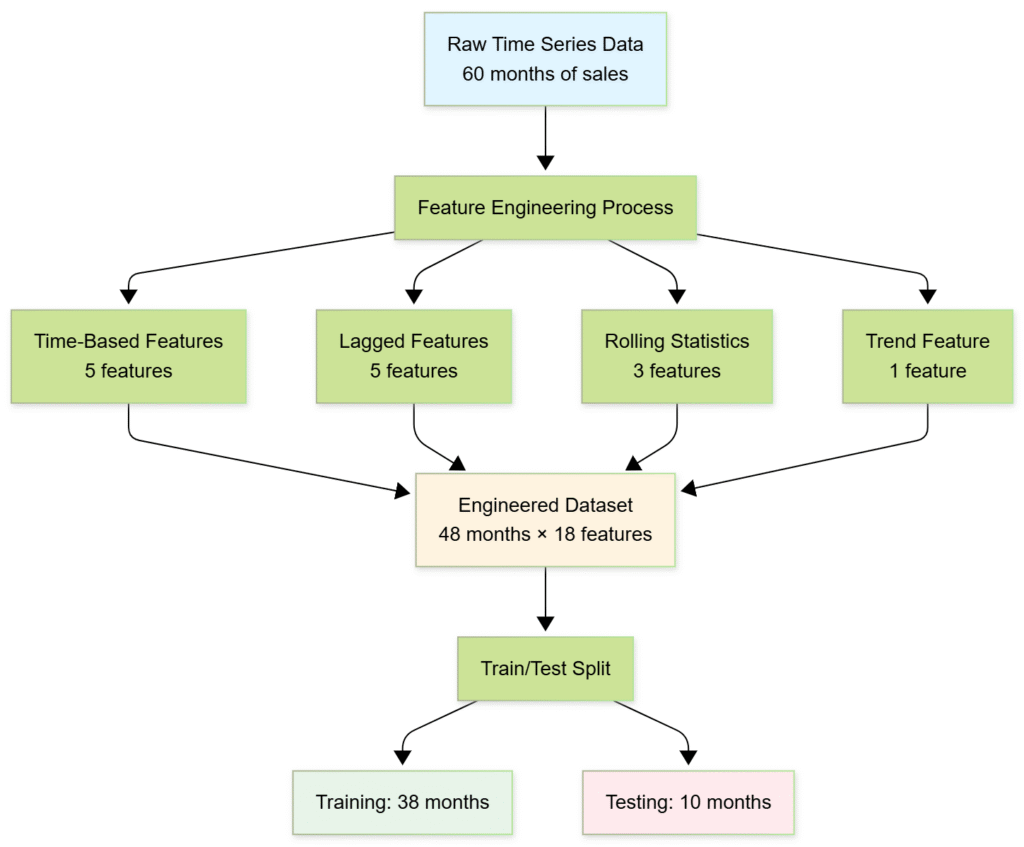
To wrap up the process for the preparation, we need to follow the workflow shown in the diagram above. The result is a machine learning-ready dataset where each observation is enriched with temporal patterns, historical context, and trend indicators that enable accurate predictions.
Practical Machine Learning Forecasting Tip
In this sales dataset, XGBoost’s feature importance revealed that the latest recent momentum and the avarage sales values of 6-month dominate predictions. This insight has operational value beyond forecasting:
Inventory management:
Last month’s sales and 6-month trend predict next month better than seasonal patterns. Adjust reorder points based on these metrics rather than rigid monthly schedules.
Capacity planning:
If rolling 6-month average is rising, you’re in a growth phase—prepare for sustained higher demand, not temporary spikes.
Promotional planning:
The model learned that recent momentum matters more than calendar position. Promotions during growth periods (high rolling_mean_6) may amplify upward trends more than promotions during flat periods.
Feature importance transforms forecasting from prediction into strategic intelligence. You’re not just forecasting sales—you’re understanding business dynamics.
Series Conclusion: Choosing Your Forecasting Approach
After comparing traditional statistical methods (ARIMA, ETS, TBATS) and machine learning (XGBoost), the accuracy rankings tell a clear story:
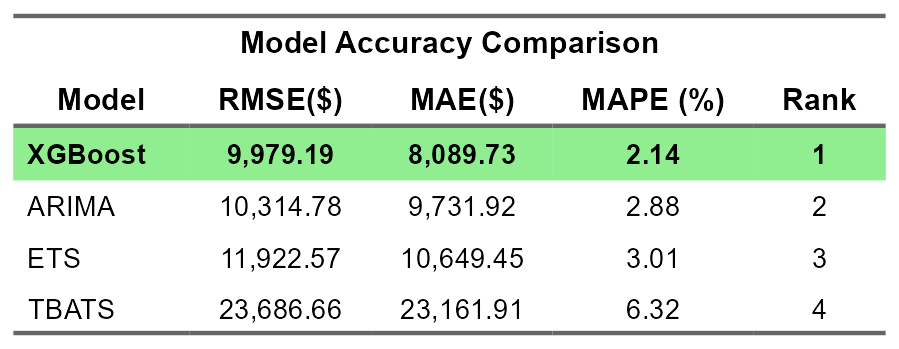
SATOM’s Recommendation:
Start with ARIMA for 90% of business forecasting needs. It delivers excellent accuracy (2.88% MAPE) with minimal complexity, runs in seconds, and provides statistically rigorous confidence intervals.
Upgrade to XGBoost when:
- You need to understand what drives sales (feature importance)
- You’re forecasting at scale (100+ products/locations)
- Non-linear relationships exist in your data
The best forecasting model isn’t the most sophisticated—it’s the one that balances accuracy, interpretability, and maintainability for your specific business context.
Additional Resources
- XGBoost documentation and tutorials – Official implementation guides
- The Role of Machine Learning in Data Analytics and Business Intelligence – ONYX Data
- Article 2: Traditional forecasting model comparison – ARIMA, ETS, TBATS baseline performance
- Article 1: Sales forecasting fundamentals – Data preparation and core concepts