The pharmaceutical industry relies heavily on exhibitions like CPHI Japan exhibition analysis to forge partnerships, discover innovations, and expand market presence. At SATOM, we’ve developed a comprehensive business intelligence dashboard that transforms CPHI Japan’s official exhibition data into actionable insights for pharmaceutical professionals planning their 2026 trade show strategy.
This article explores our newly launched CPHI Japan Exhibition Analysis Dashboard, demonstrating how advanced data reporting services can revolutionize your approach to pharmaceutical trade shows. Whether you are an exhibitor, organiser, or market researcher, our CPHI Japan exhibition analysis platform provides the competitive intelligence you need.
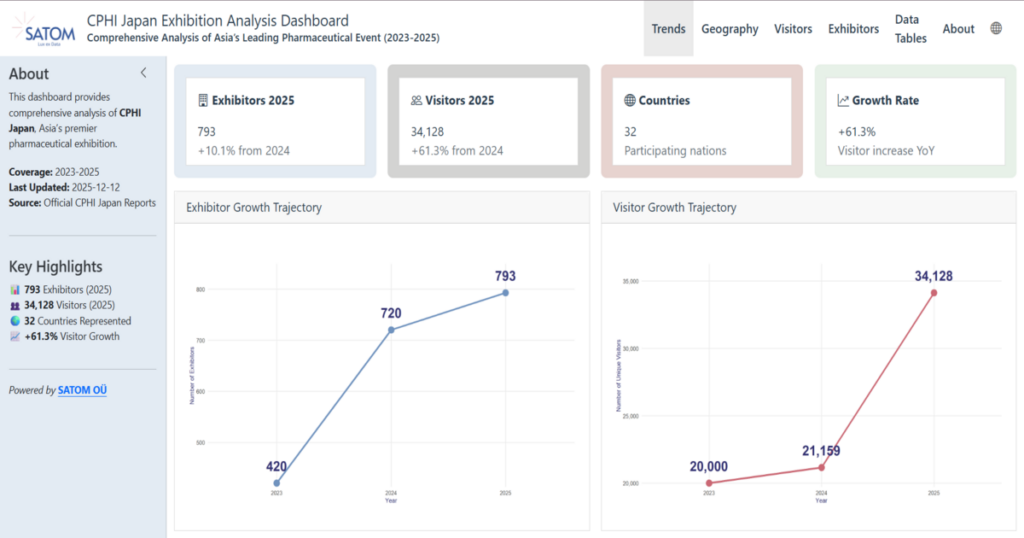
Table of Contents
What is CPHI Japan? Understanding the Premier Pharmaceutical Exhibition
CPHI (Convention on Pharmaceutical Ingredients) represents the world’s most influential series of pharmaceutical exhibitions, connecting manufacturers, suppliers, and industry leaders across global markets. Conducting a thorough CPHI Japan exhibition analysis before attending is essential for companies aiming to maximise their trade show ROI. The CPHI network includes:
- CPHI Japan – Asia’s gateway to pharmaceutical innovation
- CPHI Europe – The industry’s largest annual gathering
- CPHI India – South Asia’s pharmaceutical powerhouse
- CPHI Americas – North American market opportunities
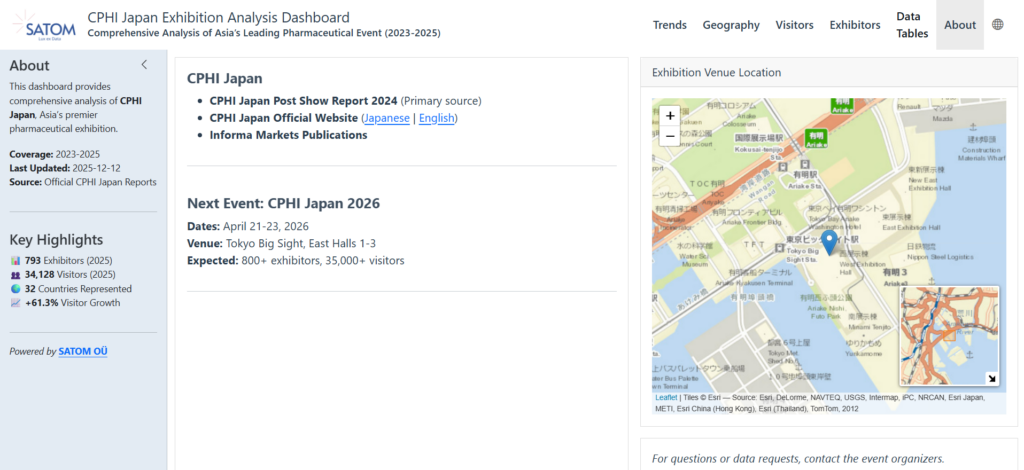
CPHI Japan, scheduled for April 2026, serves as a critical networking hub for companies seeking to penetrate the Japanese and broader Asian pharmaceutical markets. Understanding historical trends and attendee patterns through rigorous CPHI Japan exhibition analysis is essential for maximizing exhibition ROI. You can also explore our related article on Japan Market Entry Strategy to complement your trade show preparation.
Making Sense of Exhibition Big Data
Pharmaceutical companies face several challenges when evaluating trade show participation without proper CPHI Japan exhibition analysis tools:
- Overwhelming data volumes from multiple exhibition years
- Complex attendee demographics across regions and sectors
- Measuring exhibition effectiveness beyond simple attendance numbers
- Competitive intelligence about industry trends and participant behavior
- Budget justification for exhibition investments
Traditional static reports fail to provide the interactive exploration necessary for strategic decision-making. This gap inspired SATOM to create a dynamic business intelligence solution purpose-built for CPHI Japan exhibition analysis. Learn more about our data reporting services and how they support pharmaceutical market strategy.
CPHI Japan Exhibition Analysis Dashboard: Key Features
Interactive Data Visualizations
Our Exhibition Analysis Dashboard leverages official CPHI Japan reports to deliver comprehensive exhibition analytics. The CPHI Japan exhibition analysis platform includes:
- Dynamic charts that respond to user selections
- Drill-down capabilities for detailed segment analysis
- Year-over-year comparison tools
- Real-time filtering by attendee type, region, and company size
Geographic Intelligence
- Interactive maps showing attendee distribution
- Regional concentration analysis
- International participation trends
- Market opportunity identification
NPS Score Analysis
Net Promoter Score (NPS) is a key feature engineering metric within our CPHI Japan exhibition analysis framework. NPS scores help quantify:
- Attendee satisfaction levels
- Exhibition value perception
- Likelihood of future participation
- Benchmark performance against industry standards
Custom Branding and Professional Design
- Brand-consistent color schemes
- Professional typography choices
- Responsive design for mobile and desktop
- Corporate identity integration
Technology Stack Behind the CPHI Japan Exhibition Analysis
Development Tools and Platforms
Our CPHI Japan exhibition analysis dashboard showcases SATOM’s technical capabilities in data reporting and business intelligence:
Development Framework: Quarto
- Modern publishing system for data science
- Seamless integration of narrative content and interactive visualizations
- Professional output quality suitable for client presentations
Software Platform: Positron
- Next-generation data science IDE
- Enhanced R programming environment
- Streamlined dashboard development workflow
Programming Language: R
- Comprehensive statistical computing capabilities
- Extensive visualization libraries (ggplot2, plotly, leaflet)
- Robust data manipulation tools (dplyr, tidyr)
What the CPHI Japan Exhibition Analysis Reveals
Strategic Insights from Historical CPHI Japan Data
Our dashboard’s CPHI Japan exhibition analysis of official reports reveals several strategic insights across four key dimensions:
Attendee Growth Patterns
- Consistent year-over-year attendance increases
- Growing international participation
- Emerging market expansion trends
Sector Distribution
- API (Active Pharmaceutical Ingredients) manufacturers dominate
- Contract manufacturing services show strong growth
- Increasing representation from packaging and formulation sectors
Geographic Trends
- Japanese domestic companies remain core participants
- Rising Asian market participation (China, Korea, India)
- European pharmaceutical companies maintain strong presence
Satisfaction Metrics
- High NPS scores indicate strong exhibition value
- Repeat participation rates exceed 70%
- Networking effectiveness rated as top value driver
Why Your Business Needs Exhibition Analysis Dashboards
Benefits for Pharmaceutical Companies
Investing in CPHI Japan exhibition analysis delivers measurable advantages across strategic planning, competitive intelligence, and ROI measurement:
Strategic Planning
- Data-driven booth selection based on competitor positioning
- Optimal timing for product launches
- Resource allocation optimization
Competitive Intelligence
- Industry participation trends
- Emerging competitor identification
- Market positioning analysis
ROI Measurement
- Quantifiable exhibition impact metrics
- Lead quality assessment
- Cost-per-contact calculations
Market Research
- Industry sentiment tracking
- Technology adoption trends
- Partnership opportunity identification
Benefits for Exhibition Organizers
Performance Benchmarking
- Year-over-year comparison metrics
- Attendee satisfaction tracking
- Competitive exhibition analysis
Marketing Optimization
- Data-driven promotional strategies
- Target audience refinement
- Communication effectiveness measurement
SATOM’s Business Intelligence Services: Beyond CPHI Japan
While the CPHI Japan dashboard demonstrates our exhibition analysis capabilities, SATOM provides comprehensive data reporting and business intelligence services across multiple industries. Our expertise in CPHI Japan exhibition analysis is just one example of how we turn raw data into strategic advantage. Explore our full range of analytics and BI services.
Data Reporting Services
- Automated report generation
- Custom KPI tracking
- Multi-source data integration
- Real-time reporting solutions
Sales and Marketing Analysis
- Campaign performance tracking
- Customer journey mapping
- Attribution modeling
- Conversion funnel optimization
Business Intelligence Dashboards
- Executive summary dashboards
- Operational performance monitoring
- Financial analytics visualization
- Predictive analytics integration
Industry Expertise
- Pharmaceutical and healthcare
- Manufacturing and supply chain
- Retail and e-commerce
- Professional services
Visit SATOM’s website to learn more about our data analytics solutions and discover how our CPHI Japan exhibition analysis dashboard can transform your 2026 trade show strategy.