


Supplier relationship management reporting is one of the most time-consuming tasks for procurement and marketing managers. Collecting data, building charts, writing key findings, and formatting branded documents can take hours — time that should be spent on strategic decisions, not manual reporting. If you manage supplier relationships and still struggle to produce clear, professional reports for stakeholders, this article reveals exactly how to cut that time down to minutes.
Table of Contents
The Reporting Problem in Supplier Relationship Management
Procurement teams spend an average of 3–5 hours per week on supplier relationship management reporting alone, according to research by Gartner’s Supply Chain practice. The core challenge is fragmentation: data lives in spreadsheets, emails, and ERP systems, while stakeholders expect polished, branded documents. The gap between raw data and a presentation-ready report is where productivity disappears.
SATOM’s Supplier Relationship Management application was built specifically to close that gap. It consolidates data input, performance dashboards, and branded PDF generation into a single web application — no design tools, no manual formatting, no wasted hours.
From Data Input to PDF Report
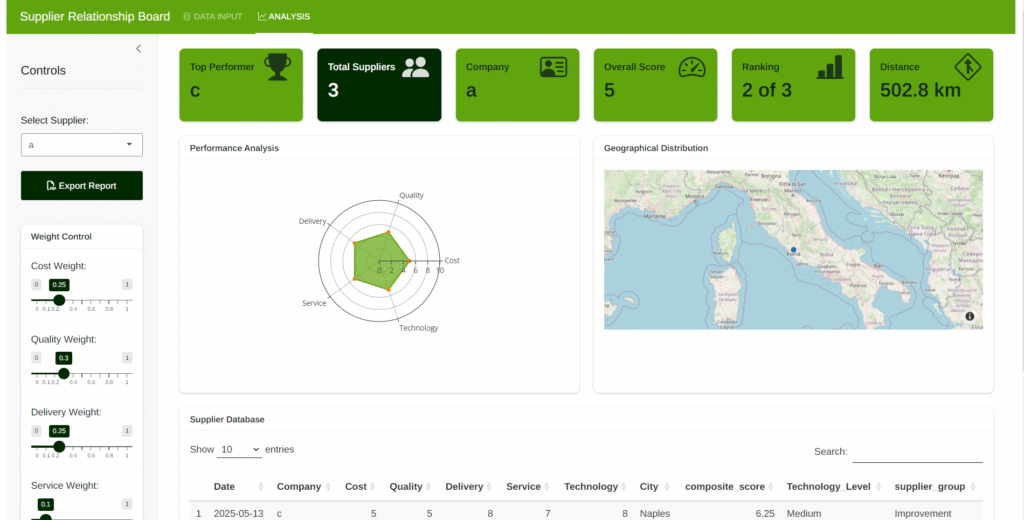
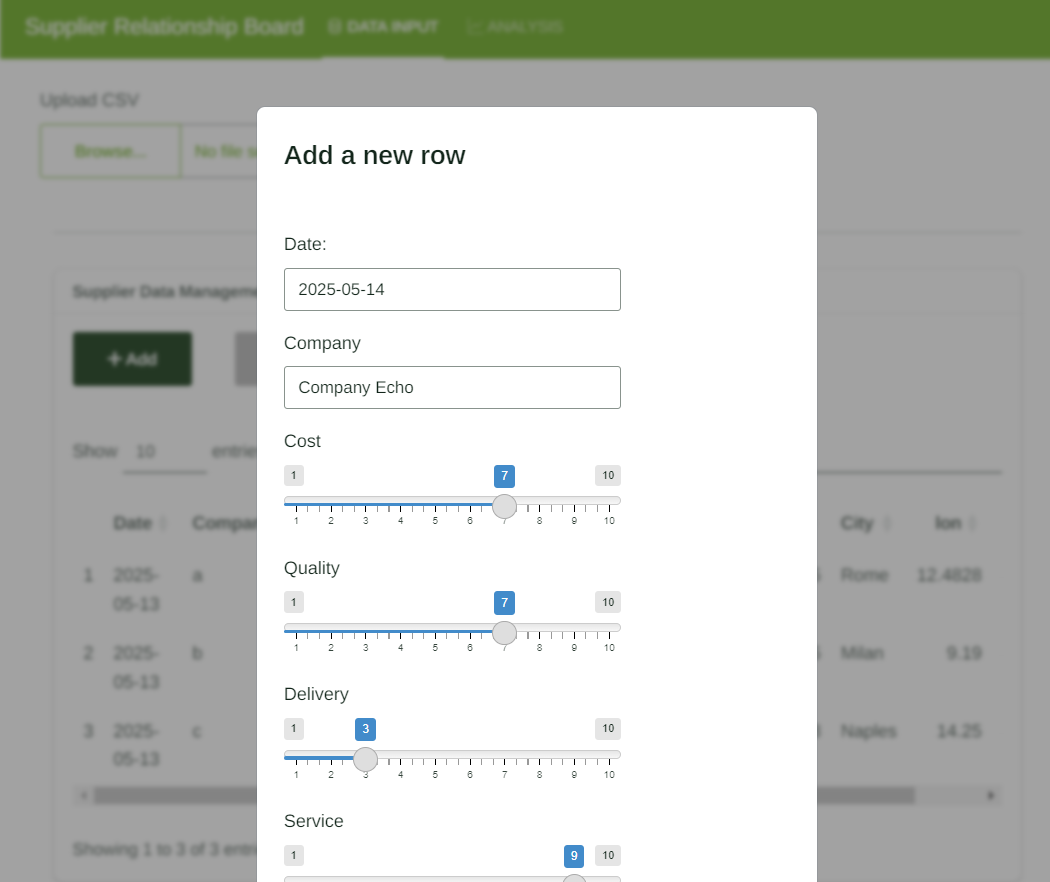
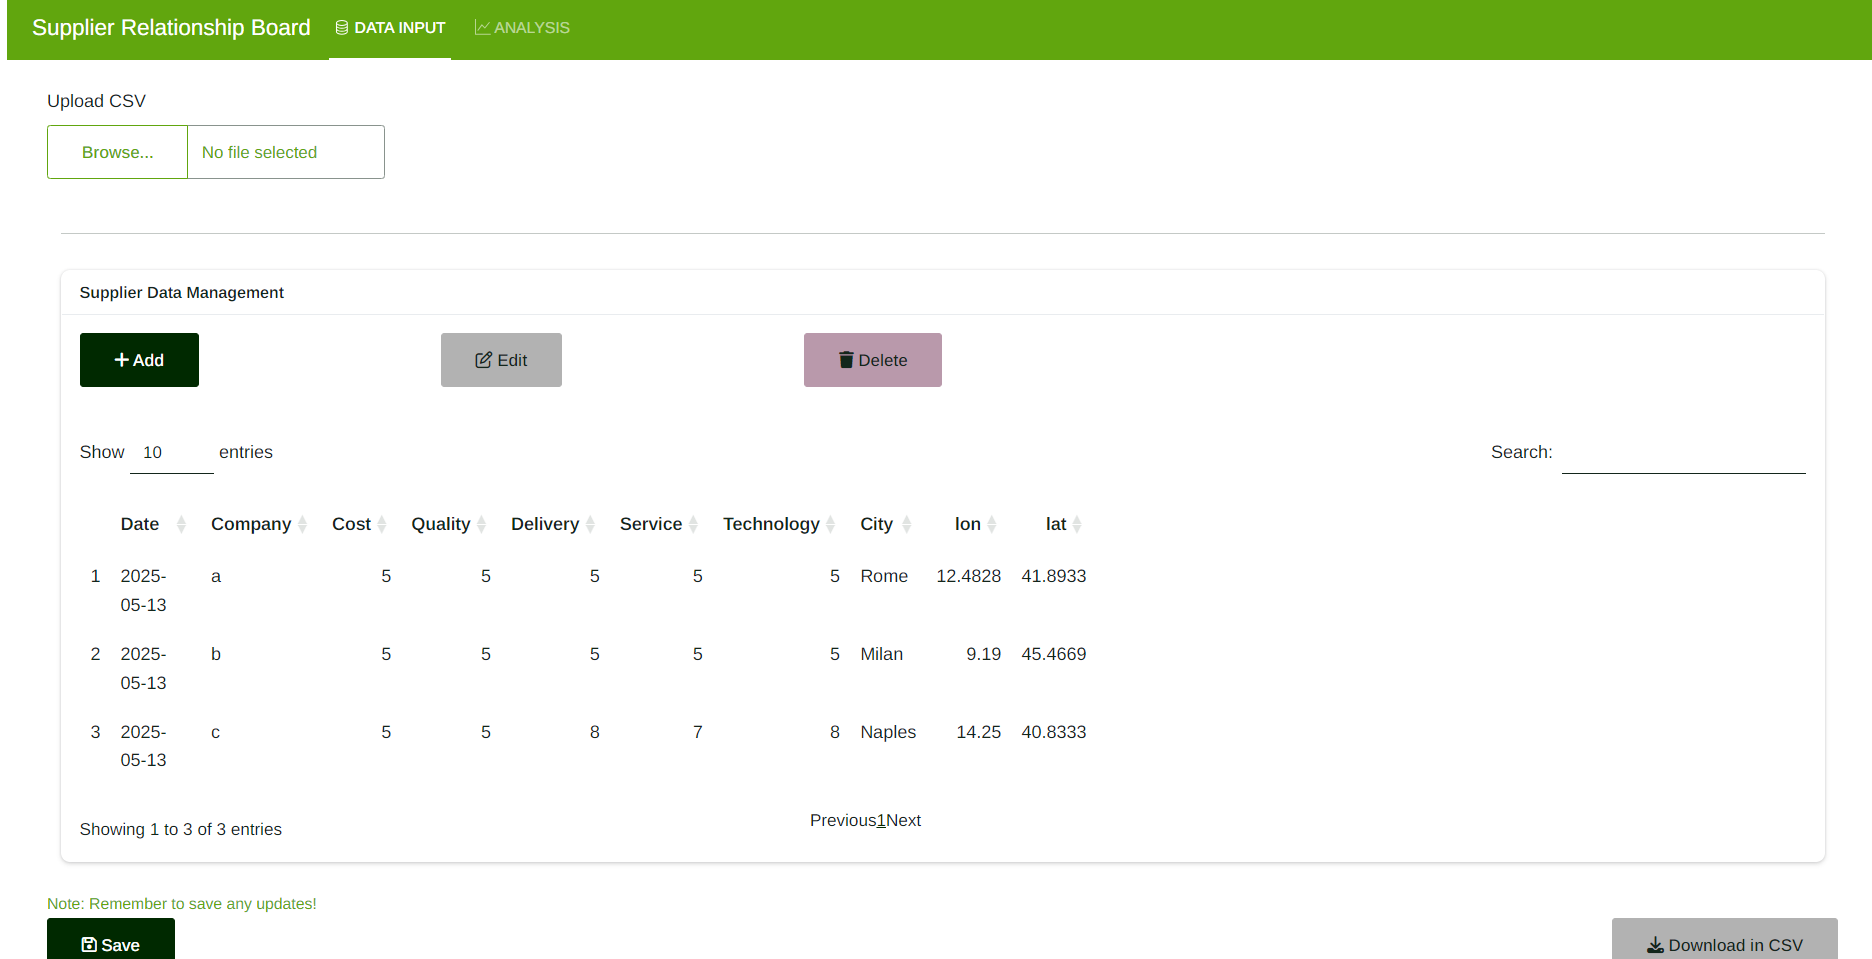
The supplier relationship management workflow in SATOM follows three simple steps: input, analyse, and export. You can upload CSV files or enter data directly in the web app. On the analysis page, select any supplier to display its performance on an interactive dashboard. When you’re ready to share with stakeholders, click the PDF button to download a fully formatted, branded document in seconds.
Unlike generic AI-generated documents or templated tools, SATOM tailors every report with your brand colours, fonts, and objectives — so what your executives receive reflects your organisation, not a generic software product.
What the Supplier Relationship Management Dashboard Shows You
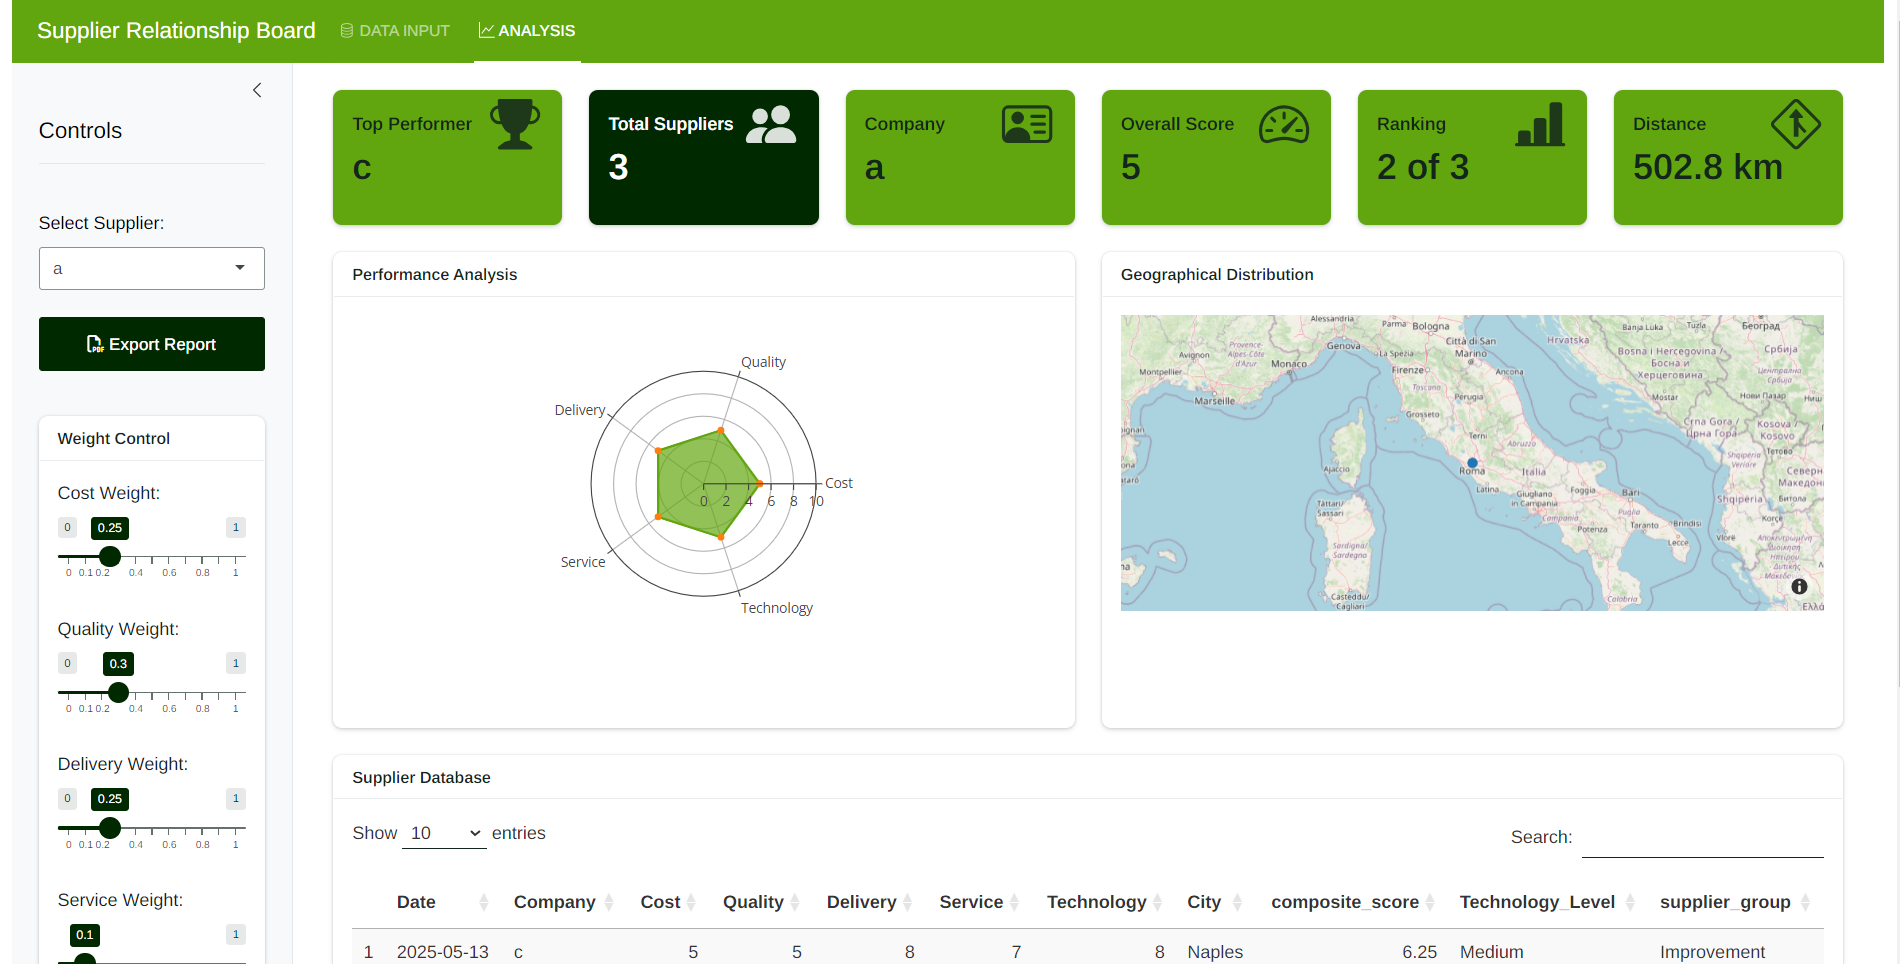
The intuitive dashboard gives procurement managers critical metrics at a glance, without needing to open a spreadsheet or run a separate BI tool. Key features include:
- Performance radar charts comparing quality, delivery, cost, service, and technology across suppliers
- Geographical distribution map showing where your suppliers are located globally
- KPI cards highlighting top performers, composite scores, and rankings at a glance
- Comprehensive data tables with customisable search and filter options for deep dives
- Weighted scoring controls to adjust metrics based on your current business priorities
This level of supplier relationship management visibility — previously available only through expensive BI platforms or manual Excel work — is now accessible through a single web application designed for operational teams.
Real-World Applications
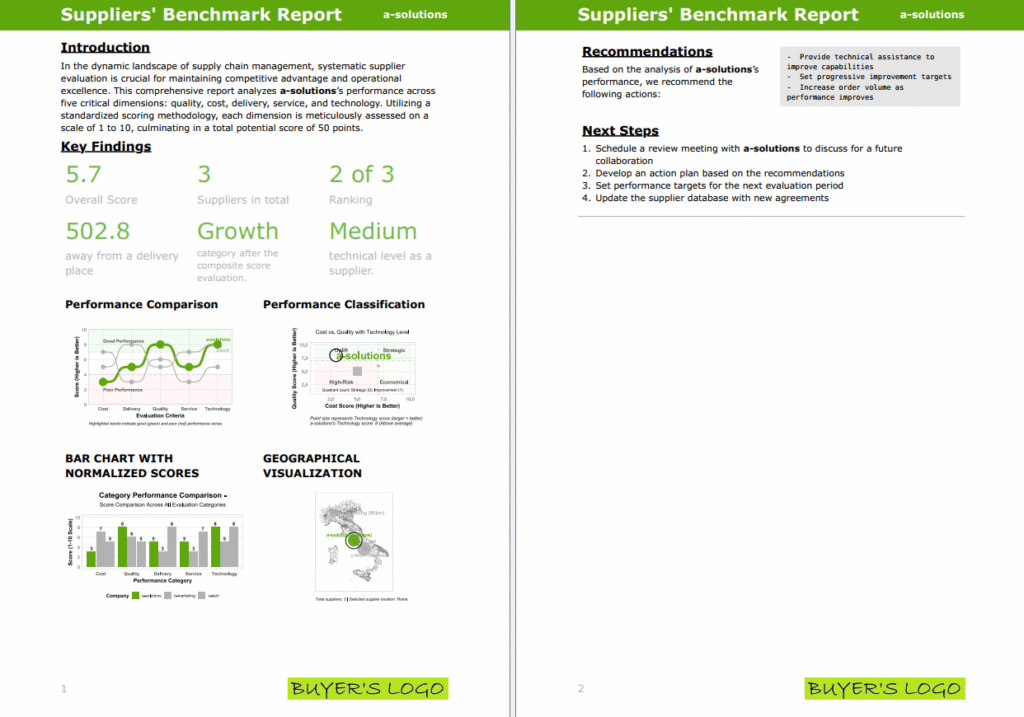
SATOM clients in manufacturing have reduced report generation time by 85% while increasing supplier performance visibility across departments. The PDF layout and content are fully customisable, and basic authentication functions are available to control access.
When a procurement manager needs to justify supplier selections to executives, they can now generate professional, branded reports in minutes instead of hours. For organisations managing 20, 50, or 200+ suppliers, that time saving compounds fast — and the consistency of output builds trust with stakeholders who rely on those documents to make decisions worth millions.
This approach aligns with broader procurement digitalisation trends. According to McKinsey’s Procurement 2025 research, organisations that digitise supplier management processes report significantly higher performance visibility and faster decision-making cycles. SATOM puts that capability within reach for teams of any size.
5 Secrets to Faster Supplier Relationship Management Reports
Based on how procurement teams use SATOM, here are the five practices that make the biggest difference:
- Centralise your data in one place. Fragmented data across email, Excel, and ERP systems is the single biggest cause of slow reporting. A dedicated supplier relationship management application eliminates the aggregation step entirely.
- Set weighted KPIs upfront. Decide which metrics matter most — quality, delivery speed, cost, or innovation — before collecting data. Weighted scoring makes comparison instant rather than manual.
- Use visual dashboards before writing prose. Let charts tell the story first. Executives absorb radar charts and KPI cards faster than tables of numbers. Generate the visuals automatically, then add only the narrative context they require.
- Automate brand formatting. Every report should look like it came from your team, not a software template. Storing brand colours and fonts inside your reporting tool removes the final manual step that delays distribution.
- Generate, review, and distribute in one session. With the right supplier relationship management tool, the entire process — data review, dashboard check, PDF export, stakeholder send — should fit inside 15 minutes, not 15 hours.
Want to understand more about what best-in-class supplier management looks like? The Chartered Institute of Procurement & Supply (CIPS) publishes useful frameworks and benchmarks on supplier relationship management practices that complement the operational tooling described here.
You can also explore how SATOM handles related challenges in our article on data visualisation for procurement teams and our guide to branded report generation for B2B stakeholders.
Let’s Collaborate
Are you still spending hours on supplier relationship management reports that should take minutes? Let’s discuss how SATOM can customise this solution for your specific needs — whether that means custom KPIs, specialised reporting formats, or integration with your existing ERP or procurement systems.